Cloud FinOps strategy: Autonomous detection and remediation of underutilized EC2 and RDS infrastructure
Unallocated cloud infrastructure represents an unacceptable friction point on gross margins. Across modern B2B SaaS deployments, development and staging inst...
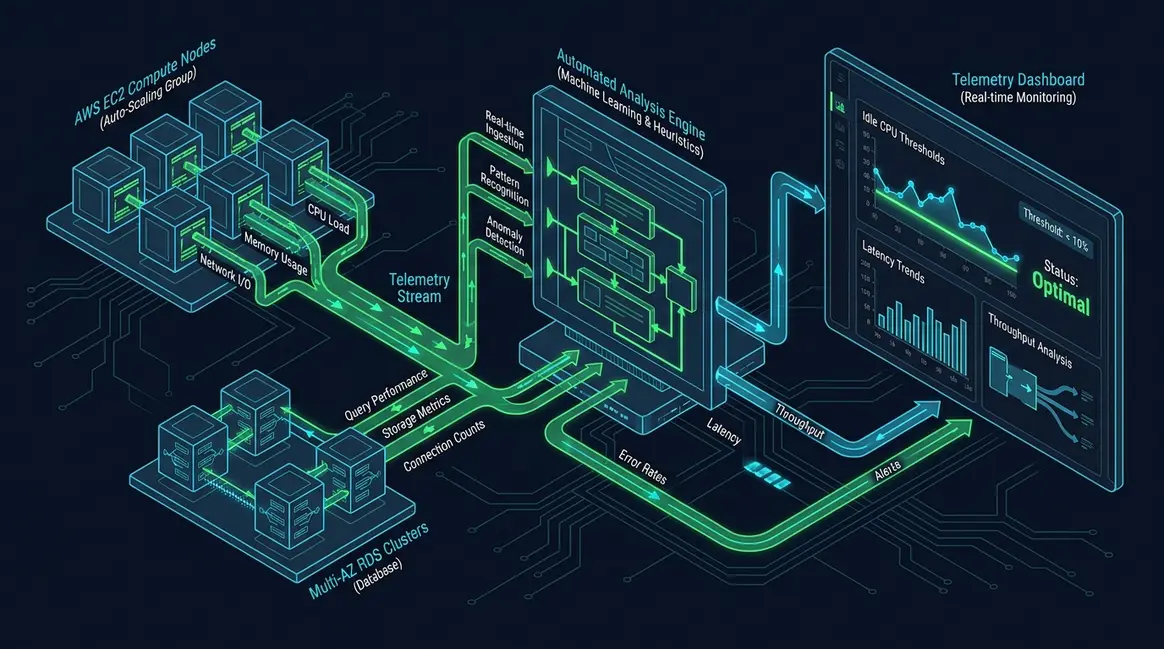
Table of Contents
- The structural failure of legacy Cloud FinOps in asynchronous architectures
- Telemetry ingestion: Constructing high-resolution CloudWatch metrics pipelines
- EC2 rightsizing heuristics: Deterministic algorithms for compute optimization
- RDS cost telemetry: Uncovering idle read replicas and over-provisioned storage
- Zero-touch remediation: Orchestrating automated rightsizing via serverless execution
- Scaling unit economics: Transforming infrastructure efficiency into enterprise MRR expansion
The structural failure of legacy Cloud FinOps in asynchronous architectures
Legacy cloud financial governance is fundamentally misaligned with event-driven runtime environments. Traditional cost management models rely on retrospective invoicing reviews, monthly procurement spreadsheets, and native tools like AWS Cost Explorer, which ingest billing records with a 24-to-48-hour latency. While this cadence accommodated monolithic, static servers on multi-year reservation commitments, it fails entirely in asynchronous microservice topologies where computing assets scale dynamically up and down within minutes.
The Telemetry Lag in Modern Compute
The gap between retrospective financial accounting and sub-minute infrastructure lifecycle management introduces massive operational blind spots. When engineering teams deploy containerized workers, ephemeral CI/CD environments, and preview branches on multi-tenant Kubernetes clusters, unit costs become detached from immediate visibility. Retrospective cost allocation cannot determine whether an autoscaling event was triggered by legitimate organic demand or a deadlocked asynchronous queue thread provisioning compute in an unbounded retry loop.
Engineering velocity outpaces financial visibility when cost attribution is decoupled from application runtime telemetry. Relying on post-hoc invoice analysis guarantees that budget overruns are discovered only weeks after the billing cycle locks, rendering root-cause remediation ineffective against obsolete traces.
Silent Drift and Ephemeral Asset Sprawl
Modern engineering waste rarely stems from catastrophic provisioning errors; it compounds through micro-inefficiencies and silent infrastructure drift across decoupled architectures:
-
Orphaned Staging and Development Workloads: Ephemeral staging stacks spun up for integration testing frequently outlive their pull requests, lingering unmonitored for weeks while accumulating hourly instance and EBS attachment fees.
-
Over-Provisioned Memory and IOPS Headroom: Infrastructure engineers routinely configure EC2 worker tiers and Amazon RDS instances with 3x headroom based on speculative p99 burst loads rather than actual consumption metrics, leaving baseline memory and provisioned IOPS drastically underutilized.
-
Decoupled Microservice Shadow Costs: When microservices interact asynchronously via message brokers, downstream database replicas continue running at maximum provisioned capacity long after upstream producers enter low-throughput windows.
Executing an effective Cloud FinOps strategy requires eliminating retrospective spreadsheets in favor of programmatic telemetry parsing. Rather than auditing static monthly invoices, engineering organizations must ingest continuous performance metrics—such as CloudWatch CPU credits, memory utilization via daemonsets, and RDS connection saturation—directly into automated optimization pipelines.
Bridging this architectural divide requires transitioning toward real-time telemetry orchestration. Implementing a programmatic cloud FinOps framework allows systems to evaluate live compute metrics directly against application performance constraints. Organizations that master enterprise cloud spend governance avoid financial degradation by treating infrastructure unit costs as an actionable operational metric rather than an accounting afterthought.
Telemetry ingestion: Constructing high-resolution CloudWatch metrics pipelines
Capturing operational signals across hundreds of EC2 and RDS instances requires bypassing native dashboard visualizers in favor of programmatic metric extraction. Standard CloudWatch telemetry provides hypervisor-level metrics like CPUUtilization, NetworkIn, and NetworkOut at five-minute native intervals. However, hypervisors cannot inspect the guest operating system's internal state. Relying solely on standard metrics exposes organizations to catastrophic false positives during downsizing sweeps; an instance showing 4% hypervisor CPU might be completely pinned on memory allocation, caching in-memory datastores, or thrashing swap space.
To establish an actionable Cloud FinOps strategy, infrastructure teams must deploy the unified CloudWatch Agent across all Linux and Windows workloads. The agent exposes mission-critical OS-level metrics—primarily mem_used_percent, swap_used_percent, and ephemeral storage tracking—at 60-second granularities.
The Core Telemetry Matrix
An accurate classification engine evaluates compute, memory, disk, and network interfaces in tandem over rolling 14-day evaluation windows:
| Resource Dimension | Metric Name | Collection Layer | Underutilization Signal |
|---|---|---|---|
| Processor | CPUUtilization | Hypervisor | P95 < 10% AND Max < 25% |
| Memory | mem_used_percent | CloudWatch Agent | P95 < 30% AND Max < 40% |
| Disk Throughput | VolumeReadOps / VolumeWriteOps | EBS Telemetry | Avg IOPS < 50 continuously |
| Disk Latency | DiskQueueDepth | EBS Telemetry | Near-zero queuing without spikes |
| Network Capacity | NetworkIn / NetworkOut | Hypervisor | Sustained bandwidth < 1% instance quota |
Automated Batch Ingestion and Throttling Control
Extracting these multidimensional datasets across multiple AWS regions requires decoupling querying pipelines from simple per-instance GetMetricStatistics calls. Calling GetMetricStatistics sequentially across thousands of volumes and nodes immediately exhausts AWS account-level tokens.
Engineers must use GetMetricData to pull up to 500 metric queries in a single API payload. The payload leverages MetricDataQueries arrays with client-side batching and dynamic pacing:
{
  "MetricDataQueries": [
    {
      "Id": "m1",
      "MetricStat": {
        "Metric": {
          "Namespace": "AWS/EC2",
          "MetricName": "CPUUtilization",
          "Dimensions": [
            {
              "Name": "InstanceId",
              "Value": "i-0123456789abcdef0"
            }
          ]
        },
        "Period": 300,
        "Stat": "Average"
      },
      "ReturnData": true
    }
  ],
  "StartTime": "2026-03-01T00:00:00Z",
  "EndTime": "2026-03-14T00:00:00Z"
}
CloudWatch enforces a default query quota of 50 transactions per second (TPS) on GetMetricData. If the response returns a NextToken, orchestrators must implement stateful cursor pagination rather than immediate unbounded recursive loops. In modern automated runbooks (such as n8n workflows or event-driven Lambda dispatchers), API calls execute with exponential backoff and randomized jitter to withstand burst throttling.
Legacy FinOps scripts relied on static threshold cutoffs executed via slow, batch-scheduled cron jobs that frequently hit API bottlenecks. Modern 2026 telemetry pipelines stream batch payloads directly into temporal vector spaces and lightweight local analytical models. These models detect seasonal micro-bursts, compute multidimensional utilization correlations, and identify candidates for termination or rightsizing without triggering production API halts.
EC2 rightsizing heuristics: Deterministic algorithms for compute optimization
Deterministic rightsizing models transform a blunt cost-cutting exercise into an automated, risk-mitigated Cloud FinOps Strategy. Static average utilization figures mask intermittent batch spikes and periodic cron activity; infrastructure telemetry must therefore evaluate tail latency metrics across a sliding 14-day evaluation window (T = 336\text{ hours}).
Zombie and Underutilization Criteria
An instance is classified as a zero-utility candidate (zombie) if and only if both compute and network boundaries meet the following criteria across the rolling 14-day duration:
P99(CPU_Utilization) < 5% and Sum(NetworkIn + NetworkOut) < 5 MB / 24-hour period
Instances satisfying these conditions indicate detached workers, abandoned testing artifacts, or stale staging environments. Conversely, underutilized instances exhibit active network participation but sustain flat compute profiles where P95(CPU_Utilization) < 15% and P95(Memory_Utilization) < 30%.
Instance Architecture Heuristics
Rightsizing algorithms must branch based on the underlying virtualization and hardware profile:
- Burstable Families (
T3,T4g): Evaluation must correlateCPUCreditBalanceandCPUSurplusCreditChargedwith baseline CPU. A burstable instance with a full credit balance andP99(CPU) < 5%is an idle candidate. Conversely, an instance with low baseline utilization but high memory pressure must not be downsized, as burstable tiers often serve as cheap memory hosts. - Dedicated Compute and Memory Families (
C6i,R6g,M7g): High-throughput workloads demand decoupled metric evaluation. Ac6i.2xlargewith low CPU utilization may still saturate disk I/O or network packet boundaries. The decision engine requires Amazon CloudWatch agent telemetry to verify thatP95(mem_used_percent) < 40%before triggering a step-down within the same family or cross-migrating.
The Downscaling and Graviton Decision Matrix
The remediation engine evaluates telemetry through a deterministic state machine:
| Current Telemetry Profile | Instance State | Deterministic Action |
|---|---|---|
P99(CPU) < 2% AND Network < 1 MB / day | Any | TERMINATE (Create snapshot, detach EBS, decommission) |
P95(CPU) < 15% AND P95(Mem) < 30% | x86 Dedicated (C6i, M6i) | MIGRATE_GRAVITON_DOWNSCALE (e.g., c6i.xlarge to c7g.large) |
P95(CPU) < 15% AND P95(Mem) > 70% | Compute Optimized (C6i, C7g) | REPROFILE (Shift to memory-optimized r7g.medium) |
P90(CPU) in [15%, 40%] | Arm64 Dedicated (M7g) | STEP_DOWN (Downscale one size within family) |
Automated Remediation and Telemetry Governance
Pre-AI operations relied on static threshold CSV exports that engineers manually reviewed once a quarter. Modern 2026 architectures utilize event-driven event bridges and n8n orchestration pipelines that poll CloudWatch metrics, evaluate utilization vectors against the heuristics matrix, and compile infrastructure changes as code.
To prevent destructive execution errors during automated downsizing, remediation payloads must enforce strict JSON Schema validation prior to dispatching mutations to the AWS Systems Manager or Terraform pipelines. The schema verifies that candidate instance IDs match active auto-scaling exclusions, checks minimum cluster node invariants, and confirms that target Graviton architectures match available container binaries. Once validated, the action executes automatically, closing the loop between CloudWatch metrics and cost optimization without manual triage.
RDS cost telemetry: Uncovering idle read replicas and over-provisioned storage
Database fleets frequently harbor silent budget drains. Multi-AZ PostgreSQL and Amazon Aurora clusters often carry provisioned overhead originally sized for peak concurrency events that never materialize, creating a persistent gap between billing commitments and operational demand within your cloud FinOps strategy.
Telemetry Baselines and Low-Utilization Indicators
Uncovering database over-provisioning requires querying Amazon CloudWatch metrics over sliding multi-week windows rather than relying on point-in-time snapshots. A rigorous audit isolates candidates based on four specific telemetry thresholds:
-
DatabaseConnections: Zero connections (
DatabaseConnections = 0) sustained over 7 consecutive days indicates an abandoned environment, a decommissioned staging instance, or an obsolete replica detached from application connection pools.-
Storage Saturation Trajectory:
FreeStorageSpaceexhibiting a flat line over 90 days on high-tier allocated storage indicates over-provisioning. Provisioning 1 TB on an instance utilizing only 80 GB locks capital into idle GP3 storage or io2 provisioned throughput. -
I/O Floor Drift: Read and write I/O operations (
ReadIOPSandWriteIOPS) failing to exceed baseline operational thresholds (such as remaining below 5 IOPS persistently) denote an inactive read-replica routing zero production queries. -
Latency vs. Cache Anomalies: Sporadic
ReadLatencyspikes coupled with low overall query volume reveal cache misses on oversized instances where memory is under-indexed, masking inefficiency under the guise of compute starvation. When designing optimized multi-tenant data structures, fine-grained controls such as PostgreSQL row-level security allow teams to partition access logically within shared databases rather than spinning up dedicated, underutilized RDS clusters for separate clients.
-
Detecting Orphaned Snapshots and Residual EBS Volumes
Database decommissioning scripts often omit storage tear-downs. Automated manual snapshots (rds:create-db-snapshot) generated prior to major releases frequently escape retention policies, accumulating compounding daily snapshot storage costs for years. Similarly, automated teardown scripts that terminate EC2 application nodes can leave unattached gp3 or io2 storage volumes behind if automated cascading deletes are unconfigured.
Automated auditing routines query the AWS Cost Explorer API alongside EC2 and RDS APIs:
# Identify detached EBS volumes with zero attachments
aws ec2 describe-volumes \
  --filters Name=status,Values=available \
  --query "Volumes[*].{ID:VolumeId,Size:Size,Type:VolumeType}" \
  --output table

# Identify unmanaged RDS snapshots older than 90 days
aws rds describe-db-snapshots \
  --snapshot-type manual \
  --query "DBSnapshots[?SnapshotCreateTime<='2025-12-01'].{ID:DBSnapshotIdentifier,AllocatedStorage:AllocatedStorage}" \
  --output table
Static Topologies vs. 2026 Dynamic Autoscaling
Pre-AI operations relied on static over-provisioning: provisioning multi-region read replicas at identical instance classes to the primary writer (such as matching an r6g.4xlarge primary with two identical regional readers) to guarantee failover headroom. This static pattern routinely leaves replica compute utilization below 10%.
[Primary Writer: r6g.4xlarge] ──> [Static Reader: r6g.4xlarge (Idle 92%)]
                                        │
                                        ▼ Transition
[Primary Writer: Aurora Multi-AZ] ──> [Aurora Serverless v2 (0.5 - 4.0 ACU Range)]
Modern infrastructure architectures replace static replica fleets with dynamic Aurora Serverless v2 scaling boundaries. By configuring reader nodes with granular Aurora Capacity Units (ACUs) between min_capacity = 0.5 and max_capacity = 8.0, the replica footprint tracks actual query traffic instantaneously. Autonomous telemetry agents evaluate query execution plans and replica lag in real time, shedding unneeded capacity down to fractional baselines during off-peak hours and saving up to 70% in read-tier compute costs without risking connection drops or replication desync.
Zero-touch remediation: Orchestrating automated rightsizing via serverless execution
Manual cloud cost optimization reviews introduce an unacceptable operational lag, turning resource over-provisioning into silent margin erosion. A modern Cloud FinOps strategy demands zero-touch remediation engines that treat telemetry breaches as real-time infrastructure events rather than static dashboard alerts. By routing continuous utilization signals into serverless orchestration state machines, engineering teams can eliminate idle runtime costs deterministically.
Event routing and orchestrator ingestion
The pipeline triggers when telemetry collectors (Amazon CloudWatch, Prometheus, or Datadog) record sustained threshold breaches—such as an EC2 instance averaging < 5% CPU utilization and < 200 IOPS over a rolling 14-day window, or an RDS read replica maintaining zero active connections. These breaches emit standardized JSON payloads to Amazon EventBridge or an upstream message broker.
{
  "source": "telemetry.finops",
  "detail-type": "LowUtilizationBreach",
  "detail": {
    "resourceId": "i-09f12ab34cd56ef78",
    "resourceType": "ec2",
    "environment": "staging",
    "avgCpu14d": 3.8,
    "recommendedType": "t4g.small"
  }
}
EventBridge matches the event pattern and dispatches execution tokens directly into stateful orchestrators. Using n8n workflow automation nodes or AWS Step Functions, the engine decouples metric detection from action execution, maintaining an auditable run-log across every environment.
Deterministic state validation and dry-run safety gates
Autonomous rightsizing requires robust validation layers prior to invoking mutating API calls. The orchestration layer executes a three-stage gating protocol before calling the AWS SDK:
-
Tag and Scope Audit: Validates that target resources lack production tags (
Env=prod,DataStore=primary, orDoNotModify=true). Non-production resources lacking active workloads are scheduled for off-peak shutdown (ec2:StopInstances) between 19:00 and 07:00 UTC.-
Dry-Run Execution: The engine issues an initial API request with
DryRun=truevia the SDK (ModifyInstanceAttributeorModifyDBInstance). This isolates IAM authorization failures, service limits, or virtualization type mismatches (such as HVM to Nitro architecture constraints) without impacting availability. -
Storage and Snapshot Boundary: Detached EBS volumes with zero attachment history exceeding 7 days undergo a final snapshot routine (
ec2:CreateSnapshot) before an automated purge (ec2:DeleteVolume) executes.
-
Rollback loops and telemetry verification
Once the instance type mutation executes (t3.xlarge down to t3.medium), the orchestrator registers a temporary lease in Amazon DynamoDB and triggers an automated health-check polling loop.
If CloudWatch emits system status check failures (StatusCheckFailed_System > 0) or the p95 latency on application load balancer target groups spikes above 250ms within 10 minutes of instance restart, the orchestrator triggers an automated rollback. The instance is stopped, reverted to its prior instance profile, restarted, and tagged with FinOpsReviewRequired. The orchestration state machine publishes full execution metadata, pre-change metrics, and recovery status via webhooks to Slack and PagerDuty, maintaining deterministic safety across every deployment.
Scaling unit economics: Transforming infrastructure efficiency into enterprise MRR expansion
Algorithmic infrastructure pruning is not a defensive cost-cutting exercise; it is an offensive capital reallocation mechanism. In multi-tenant enterprise architectures, gross margins dictate valuation multiples. When raw compute and storage sprawl unchecked, cost of goods sold (COGS) inflates linearly with customer acquisition, degrading software unit economics. Implementing a programmatic Cloud FinOps Strategy decouples customer growth from infrastructure expenditure, transforming unallocated AWS margins directly into capital for enterprise MRR expansion.
Algorithmic Margin Decoupling and Unit Economics
The fundamental lever of software profitability lies in compressing hosting cost per monthly active user (MAU) and compute cost per telemetry query. Traditional engineering teams treat AWS bills as an aggregate operational overhead. Modern systems engineer infrastructure to report real-time unit costs using eBPF probes, Kubernetes Pod resource metrics, and AWS Cost Allocation tags mapped directly to customer tenant IDs.
SELECT
  tenant_id,
  DATE_TRUNC('hour', usage_start_time) AS window_hour,
  SUM(unblended_cost) AS direct_compute_cost,
  COUNT(DISTINCT session_id) AS active_sessions,
  (SUM(unblended_cost) / NULLIF(COUNT(DISTINCT session_id), 0)) AS cost_per_session
FROM aws_cur_hourly_report
GROUP BY tenant_id, window_hour
ORDER BY cost_per_session DESC;
When underutilized EC2 instances (c6i.4xlarge nodes pinned at 11% CPU saturation) and over-provisioned RDS IOPS allocations are identified and compacted automatically, marginal cost per query plummets from $0.0042 to $0.0008. This 80% compression on raw compute overhead directly improves gross margins by 600 to 1,400 basis points. In enterprise software companies, a sustained 10% gross margin improvement drives an immediate 1.5x to 2.3x enterprise value multiple expansion in private and public capital markets.
Passive Governance vs. 2026 Autonomous Runtime Optimization
The legacy approach to infrastructure optimization relies on retrospective auditing: human engineers inspecting monthly billing exports, debating Reserved Instance coverage, and executing static instance downscaling weeks after usage anomalies occur.
In a modernized engineering and growth team architecture, passive governance is replaced by closed-loop, deterministic execution pipelines:
- Pre-2024 Retrospective FinOps: Weekly Slack alerts flagging idle instances based on arbitrary 5% CPU thresholds. Engineers manually schedule RDS maintenance windows, risking transient query latency and deferring rightsizing decisions.
- 2026 Autonomous Control Planes: Real-time event-driven agents (running via orchestration platforms like n8n or specialized Karpenter controllers) actively monitor compute pressure. Under-utilized EC2 fleets are automatically consolidated via bin-packing algorithms, while variable workloads migrate dynamically to Graviton-based spot instances and Aurora Serverless v2 instances that scale dynamically from 0.5 to 128 ACUs based on connection pool queuing latency.
The Enterprise Valuation Feedback Loop
Infrastructure telemetry informs operational velocity. When compute waste is structurally eliminated via autonomous pruning, engineering organizations escape the technical debt cycle of fire-fighting runaway AWS invoices.
Freeing up 20% to 35% of total cloud spend provides immediate balance-sheet liquidity. This capital is dynamically routed back into high-yield customer acquisition experiments, model fine-tuning, and low-latency edge deployment pipelines. Low unit costs yield aggressive pricing flexibility against competitors burdened with unoptimized legacy stacks, accelerating top-line customer capture while expanding bottom-line MRR. Continuous, programmatic infrastructure optimization is the definitive operational foundation of 2026 software scalability.
Compute efficiency is not an accounting exercise; it is an architectural discipline. Organizations that tolerate unallocated EC2 headroom and idle RDS instances bleed capital that belongs in core product engineering. By implementing continuous telemetry ingestion and deterministic, zero-touch remediation, you transform volatile cloud overhead into a controlled, margin-positive asset. To systematically inspect your production topologies, eliminate waste, and automate your cloud unit economics, review my comprehensive architectural advisory and technical audits.
Memo Strategici Correlati
Tutti i Memo →Structuring keyword hubs and spoke content: The deterministic topical authority map for 2026
Legacy SEO tactics are dead. In the algorithmic reality of 2026, Google Search Generative Experience (SGE) and retrieval-augmented language models discard ke...
Building custom growth dashboards in Retool and Next.js: The 2026 enterprise blueprint
Off-the-shelf BI tools are an operational deadweight. In modern enterprise operations, relying on stale SaaS analytics with five-minute latency intervals deg...
Vuoi implementare questa architettura nella tua pipeline?
Evita i lunghi cicli di vendita e le infinite call di scoperta. Invia il tuo collo di bottiglia di acquisizione o conversione per una diagnosi tecnica approfondita in asincrono.