Track Core Web Vitals in GA4 via Google Tag Manager
Real User Monitoring: Transitioning Core Web Vitals from Lab to Field Telemetry
Traditional SEO audits rely heavily on synthetic Lighthouse audits executed in controlled, simulated headless environments. While synthetic lab data pinpoints isolated render bottlenecks, it fails to surface how real users navigate disparate networks, edge locations, and hardware profiles. Capturing real-world PerformanceObserver metrics directly through client-side JavaScript via Google Tag Manager (GTM) transforms static audit reports into continuous Real User Monitoring (RUM). By tracking Largest Contentful Paint (LCP), Cumulative Layout Shift (CLS), and Interaction to Next Paint (INP)—alongside diagnostic metrics like First Contentful Paint (FCP) and Time to First Byte (TTFB)—engineering teams decouple performance analysis from the 28-day aggregated lag of Chrome User Experience Report (CrUX) data.
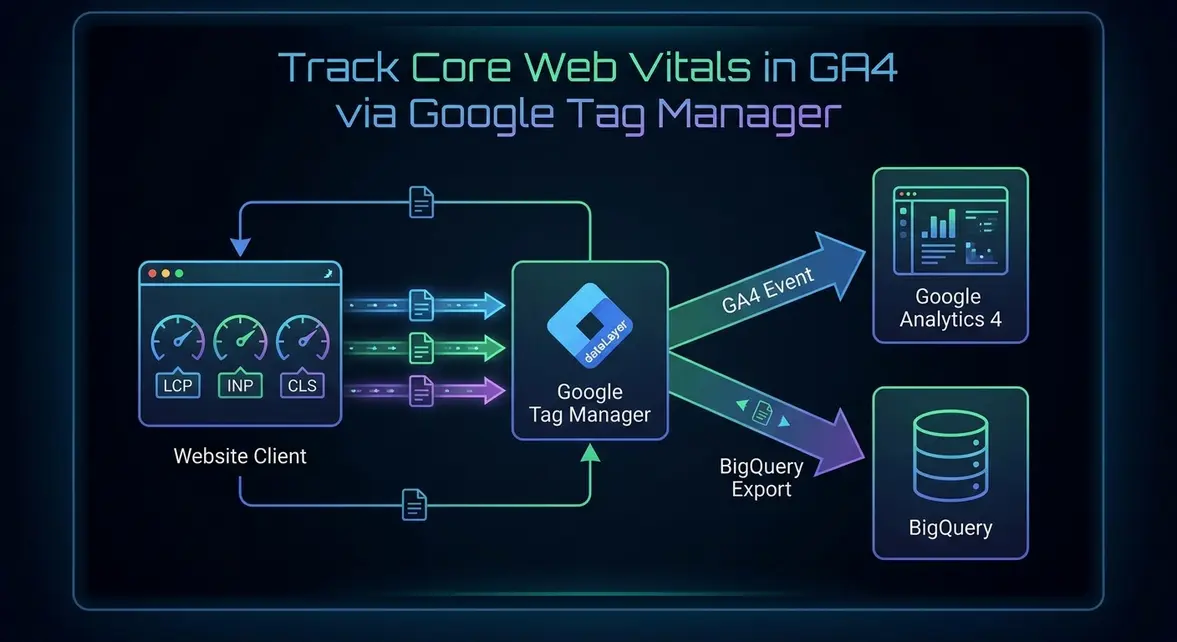
The native Google Tag Manager community template leverages the standardized web-vitals JavaScript library to listen to the browser Performance API. Each time a performance metric reaches its dispatch condition—such as after the first user interaction for INP or during page hidden states for CLS—the browser runtime triggers a push to the dataLayer. This continuous stream of field telemetry unlocks real-time operational feedback loops, allowing growth teams to spot algorithmic ranking risks and render bottlenecks immediately after deploying new site code or third-party marketing tags.
Technical SEO and Data Architecture: CrUX vs. Ingested GA4 Telemetry
Search engines leverage field data from real authenticated Chrome users to determine Core Web Vitals ranking signals. Relying exclusively on Google Search Console for Core Web Vitals reports introduces an operational bottleneck: CrUX data requires a minimum traffic threshold per page URI and averages historical metrics over a rolling 28-day window. Long-tail acquisition pages, programmatic SEO templates, and recently launched B2B landing pages often show zero data in Search Console due to insufficient traffic density, leaving growth engineers blind to critical render degradation.
Architecting an in-house RUM telemetry pipeline using GTM and GA4 bridges this gap by streaming telemetry directly to BigQuery. Each vital event generates a discrete payload containing unique identification hashes, the numeric value, the delta between updates, and the qualitative assessment category (good, needs improvement, or poor). Transporting these attributes into Google Analytics 4 allows engineering teams to segment performance along custom dimensions—such as user subscription tier, page template type, device GPU constraints, and traffic source—which CrUX aggregates away.
Implementing this architecture provides three primary operational advantages over standalone tools:
- Granular Template-Level Diagnosis: Segment raw LCP and INP values by dynamic page layout (e.g., programmatic directory vs. high-intent demo page) rather than broad origin aggregates.
- Zero CrUX Lag: Diagnose layout shifts and interaction freezes within minutes of a production release, avoiding negative ranking recalibrations caused by 28-day historical CrUX window delays.
- Deterministic Attribution: Cross-reference user bounce rates and conversion funnel drop-offs against exact millisecond latency events logged at the session level.
Marketing Operations Implementation: GTM Tag, DataLayer, and GA4 Configuration
Deploying this telemetry requires three components: the Core Web Vitals GTM template, custom DataLayer variables, and an event tag mapping data to Google Analytics 4. First, instantiate the Core Web Vitals tag template created by Simo Ahava from the GTM Community Gallery. Configure the tag to listen for Core Web Vitals (LCP, CLS, INP) along with diagnostic metrics (FCP, TTFB). Set the tag trigger to fire on the Consent Initialization or Initialization trigger to ensure listeners register before content renders.
The template executes the browser runtime logic and exposes metrics through structured dataLayer.push events using the default event name coreWebVitals. The payload structure conforms to this schema:
{
  "event": "coreWebVitals",
  "webVitalsMeasurement": {
    "name": "INP",
    "id": "v4-1711920000000-5892119200000",
    "value": 142,
    "delta": 142,
    "rating": "good"
  }
}
Within GTM, configure five Data Layer Variables mapped to the child attributes: webVitalsMeasurement.name, webVitalsMeasurement.id, webVitalsMeasurement.value, webVitalsMeasurement.delta, and webVitalsMeasurement.rating. When referenced inside custom GTM triggers or tags, wrap these parameters using standard GTM variable syntax like {{dlv - webVitalsMeasurement.name}} and {{dlv - webVitalsMeasurement.value}}.
Next, build a GA4 Event tag fired by a Custom Event trigger with the event name set to coreWebVitals. Configure the GA4 Event name to core_web_vitals, and map the following event parameters to match your BigQuery downstream export schema:
// GA4 Event Parameter Mapping Example
{
  metric_name: "`{{dlv - webVitalsMeasurement.name}}`",
  metric_id: "`{{dlv - webVitalsMeasurement.id}}`",
  metric_value: `{{dlv - webVitalsMeasurement.value}}`,
  metric_delta: `{{dlv - webVitalsMeasurement.delta}}`,
  metric_rating: "`{{dlv - webVitalsMeasurement.rating}}`"
}
To analyze the 75th percentile (p75) values across specific URLs or page types in BigQuery, run an analytical query against the nested GA4 event parameters:
SELECT
  (SELECT value.string_value FROM UNNEST(event_params) WHERE key = 'page_location') AS page_path,
  (SELECT value.string_value FROM UNNEST(event_params) WHERE key = 'metric_name') AS metric_name,
  APPROX_QUANTILES((SELECT value.int_value FROM UNNEST(event_params) WHERE key = 'metric_value'), 100)[OFFSET(75)] AS p75_metric_value,
  COUNT(1) AS sample_size
FROM
  `your-project.analytics_123456789.events_*`
WHERE
  event_name = 'core_web_vitals'
  AND _TABLE_SUFFIX = FORMAT_DATE('%Y%m%d', DATE_SUB(CURRENT_DATE(), INTERVAL 1 DAY))
GROUP BY
  1, 2
HAVING
  sample_size >= 100
ORDER BY
  sample_size DESC;
B2B Growth and Pipeline Leverage: Mitigating Funnel Attrition and High CAC
Client-side latency directly deflates enterprise demo conversion rates and inflates paid search Customer Acquisition Costs (CAC). When a paid Google Ads campaign routes high-intent enterprise traffic to a software comparison page or quote calculator, poor Interaction to Next Paint (INP > 500ms) creates perceived unresponsiveness on multi-step form fields. Marketing operations teams often mistake this friction for offer mismatch or pricing objections, triggering unnecessary discounts or copy revisions when client-side JavaScript execution lag is the true driver of drop-offs.
Capturing real-time RUM data in GA4 empowers analytics engineers to isolate technical friction from strategic conversion barriers. For instance, linking session IDs to CRM demo completions often demonstrates that sessions with an LCP under 2.0 seconds and an INP under 150ms achieve an 18% higher lead-to-opportunity velocity compared to sessions degraded by high main-thread blocking time. Eliminating client-side script bloat on key enterprise conversion paths protects paid search spend, preserves Google Ads Quality Scores, and establishes a quantifiable connection between frontend engineering velocity and annual recurring revenue (ARR).
System Telemetry Source: Original Engineering Report
Related Growth Blueprints
All Blueprints →Need this architecture deployed in your pipeline?
Skip the synchronous sales cycle and endless discovery calls. Submit your core acquisition or conversion bottleneck for a deep-dive asynchronous growth diagnostic.