Testing video vs static vs carousel ad formats in B2B paid social
Most B2B growth leaders treat creative format selection as a subjective design exercise rather than an upstream engineering problem. In 2026, relying on blen...
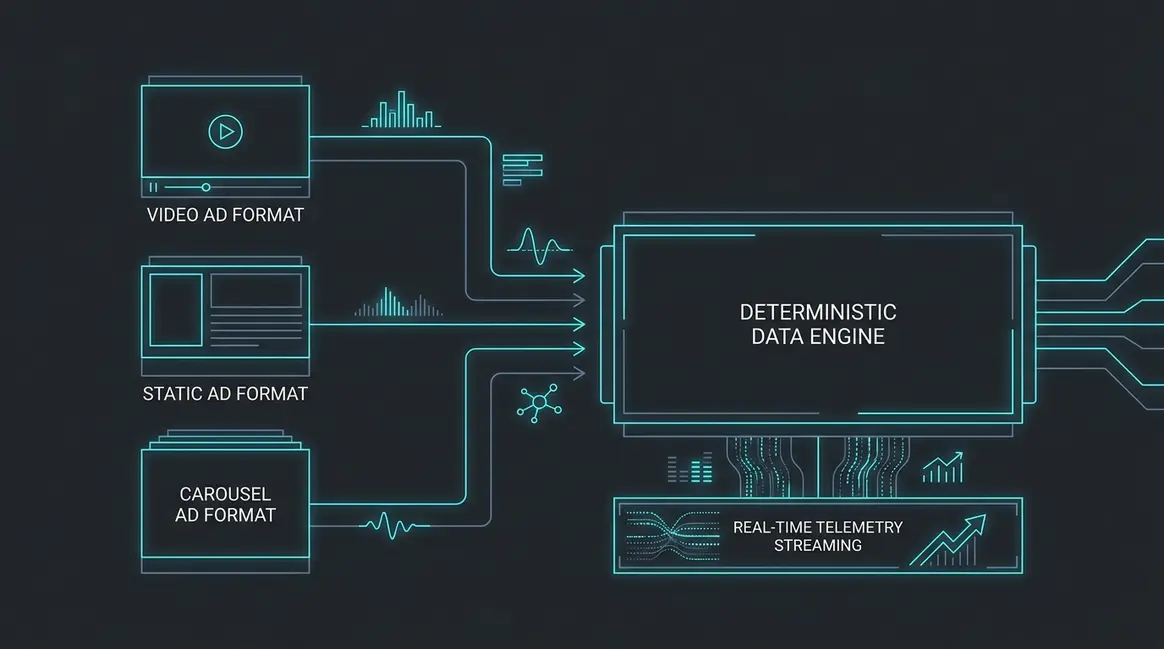
Table of Contents
- The legacy attribution failure in B2B creative testing
- Deconstructing ad formats: telemetry, cost dynamics, and latency
- Establishing a deterministic testing matrix: variables and governance
- Ingesting telemetry via server-side GTM and edge pipelines
- Mapping creative formats to enterprise buying stages
- Downstream pipeline analysis: bridging ad format data to BigQuery and CRM
- Zero-touch creative performance orchestration with n8n and AI agents
- First-party identity resolution across prolonged enterprise evaluation cycles
- Financial modeling: format-specific CAC, LTV, and burn rate optimization
- The 2026 execution blueprint: algorithmic synthesis and headless creative systems
The legacy attribution failure in B2B creative testing
Ad platforms operate under closed-loop incentives designed to maximize on-platform dwell time rather than downstream pipeline revenue. When evaluating paid social creative variants across enterprise campaigns, standard reporting interfaces inside Meta Ads Manager and LinkedIn Campaign Manager systematically bias algorithmic distribution toward video assets. This distortion stems from platform-default attribution models—specifically 1-day or 7-day view-through windows—that award full conversion credit to impressions where a user simply paused over an autoplaying video for two to three seconds without registering active cognitive intent.
Algorithmic Bias and Metric Cannibalization
Under view-through attribution models, high-frequency, low-intent media formats siphon programmatic budget away from static single-image and multi-slide carousel units. Because video delivers massive surface area for incidental impressions, algorithms register high volumes of cheap platform touches. Consequently, the bidding engine falsely attributes downstream CRM conversions to these micro-views, starving the high-intent formats that actually drive prospect action.
A technical analysis reveals the fundamental divergence between legacy platform-reported performance and ledger-verified revenue:
-
Video Formats: Inflate top-of-funnel surface metrics via video completion rates (VCR) and low cost-per-three-second view (CPV), yet frequently register sub-0.4% terminal click-through rates (CTR) and low conversion intent.
-
Static Formats: Drive deterministic, zero-latency clicks directly into technical whitepapers or interactive sandboxes, presenting higher up-front cost-per-click (CPC) metrics while securing actual intent.
-
Carousel Formats: Yield high engagement depth via card sequencing and deliberate swipe-throughs, effectively qualifying technical personas before the click occurs.
-
Telemetry Breakdown Across Enterprise Buying Cycles
Relying on client-side pixels or default multi-touch attribution (MTA) tools creates massive telemetry blind spots across 90- to 180-day enterprise sales cycles. Modern ad blockers, browser privacy partitions, and Safari ITP strip tracking parameters within 24 hours, fragmenting a single prospect's journey into disparate, anonymous sessions.
[Ad Impression: Video/Static/Carousel]
       │
       ▼ (Browser ITP / Ad-Blocker strips cookies)
[Client-Side Tag] ──X──> (Platform Loss: Data Fragmented)
       │
       ▼ (Resilient Ingestion)
[Server-Side Edge Pipeline] ───> [First-Party Data Warehouse] ───> [Deterministic CRM Match]
To reconstruct authentic conversion paths, growth teams must bypass browser-level heuristics entirely. Implementing hit-level custom dimensions attribution enables engineering teams to bind deterministic user-agent signatures, organization identifiers, and raw click IDs to server-side event streams. Without this first-party telemetry layer, multi-touch algorithms cannot correlate upstream creative touches with deep-funnel milestones.
Deep-Funnel Velocity vs. Superficial Engagement
In 2026 growth architectures, evaluating paid social creative shifts from soft metrics to pipeline mechanics. Legacy workflows evaluated ad variants through cost-per-lead (CPL) and in-platform completion rates. Modern data pipelines route hit-level telemetry into an event bus (such as an edge worker or an n8n orchestration flow) that directly queries data warehouses:
PipelineVelocity = (SQLs * WinRate * ACV) / SalesCycleDays
Evaluating creative formats using this equation surfaces stark realities: video often introduces higher pipeline drag due to unqualified lead volume, while dense, technically accurate static ads shorten MQL-to-SQL velocity by filtering out non-technical personas at the impression layer. Server-side event ingestion guarantees that platform algorithms receive real purchase value signals rather than uncalibrated view-through noise.
Deconstructing ad formats: telemetry, cost dynamics, and latency
Optimizing paid social creative requires evaluating ad formats not merely as visual assets, but as client-side software payloads competing within bidding auctions and edge delivery networks. In enterprise B2B environments, where target profiles browse under constrained mobile bandwidth or strict enterprise firewalls, the delivery telemetry of static, carousel, and video units directly governs conversion funnel integrity.
Asset Payload Latency and Ad-to-LCP Retention
Static single-image assets (WebP/AVIF compressed under 150 KB) exhibit near-zero edge delivery latency. When a buyer clicks a static creative, the client device has experienced minimal memory pressure and zero background thread contention from media decoders. This maximizes ad-to-LCP (Largest Contentful Paint) retention:
-
Pre-AI Baseline (Pre-2024): Manual asset exports resulted in 1.2 MB PNG payloads, triggering network queue latency on mobile edge connections and driving ad-to-landing-page drop-offs above 28%.
-
Modern 2026 Architectures: Edge-optimized, dynamically served image payloads load in under 120 milliseconds. The native in-app browser initializes the DOM while the underlying system memory remains unencumbered, reducing bounce rates between ad click and landing page LCP (
< 1.8s) to under 9%. -
Cost Dynamic: Static formats reliably produce the lowest CPM distributions across LinkedIn and Meta auctions due to broad inventory compatibility and minimal rendering overhead across legacy native shells.
Interactive State Machines: Carousel Qualification Mechanics
Carousel formats operate as stateful interaction loops. Each sequential card demands deliberate micro-engagements (horizontal drag vectors) before an outbound navigational event emits. This behavioral threshold radically alters traffic economics:
-
Mechanical Friction as a Filter: Forcing two or more card interactions before a target reaches an outbound CTA introduces intentional friction. This filters out accidental taps and unengaged prospects, eliminating low-intent click volume.
-
Yield Telemetry: While multi-card payloads elevate raw CPC by 22% to 40% relative to single-image ads, downstream lead qualification improves. Session duration on destination URLs increases by an average of 1.7x because users have already processed structured product telemetry (e.g., architecture diagrams, modular pricing, API integration flows) across individual cards.
-
Payload Cost: The client engine must pre-fetch multiple image assets simultaneously, increasing local memory consumption and network queue times if edge bundling is unoptimized.
Video Streaming Telemetry and Mobile Feed Degradation
Video streaming introduces high variability across feed environments. In mobile enterprise environments, autoplaying dynamic bit-rate streams (HLS/DASH) clash with network throttles and muted sound settings:
-
Muted Feed Processing: Over 82% of B2B social feeds operate with mute defaults. Video assets lacking dynamic kinetic typography or burn-in SRT transcripts lose 70% of message comprehension within the first 3-second hook window.
-
Mid-Roll Drop-off Curves: Auction telemetry reveals an exponential drop-off curve: 65% of viewers churn prior to second 4, with stabilization occurring only among hyper-qualified accounts between seconds 6 and 12.
-
Bandwidth Overhead: High initial video buffer latency delays playback initiation. If the platform cannot complete initial buffer acquisition within 400 milliseconds, the user scrolls past, registering an auction impression without visual absorption.
| Metric Axis | Static Single-Image | Multi-Card Carousel | Video (HLS / MP4) |
|---|---|---|---|
| Bandwidth Overhead | Ultra-low (< 150 KB) | Moderate (400 KB - 1.2 MB) | High (2.5 MB - 15 MB+) |
| Attention Capture Speed | Immediate (< 500 ms) | Segmented (1.2s - 3.5s) | Dynamic Hook (0 - 3.0s) |
| Qualification Telemetry | Low (Relies on ad copy) | High (Swipe state tracking) | Granular (Watch-time quartiles) |
| Auction CPM Profile | Low to Baseline | Moderate | High (Premium inventory) |
Establishing a deterministic testing matrix: variables and governance
To evaluate video, static, and carousel formats systematically, your experiment design must treat the asset presentation layer as the sole independent variable. In paid social creative pipelines, ad network delivery algorithms default to maximizing cheap in-platform interactions rather than downstream pipeline velocity. Without strict architectural controls at the campaign level, network-level automation distorts delivery, rendering cross-format performance data statistically invalid.
Algorithmic Skew and Budget Allocation Architecture
Using Campaign Budget Optimization (CBO) or Meta's Advantage+ Budget configuration destroys format split-tests. When video, static, and carousel assets run within the same dynamic budget pool, the pacing algorithm rapidly detects that video assets produce lower cost-per-impression (CPM) rates and fractional penny video views (3-second plays or ThruPlays). Consequently, the model shifts 70% to 90% of the aggregate spend toward the video format within 48 hours.
This dynamic creates an artificial selection bias. The video asset receives disproportionate impression volume at the expense of high-intent static and carousel impressions, despite static assets frequently delivering higher down-funnel SQL conversion rates. To prevent this skew, you must isolate formats using Ad Set Budget Optimization (ABO):
-
Equalized Capital Allocation: Enforce discrete, identical daily budget caps per ad set (for example, exactly $150 per day per variant) to ensure parallel distribution pacing across each creative format.
-
Audience Siloing: Target the exact same firmographic parameters—such as verified B2B account lists or narrow job function queries—across split ad sets while applying strict mutual exclusions to eliminate internal audience overlap.
-
Bidding Uniformity: Standardize bid parameters across all active sets. Use lowest-cost pacing without manual bid caps during the initial phase to establish a true baseline, or deploy uniform cost-caps derived from downstream payback thresholds.
-
Asset Normalization and Tracking Uniformity
Evaluating format performance requires standardizing every peripheral asset element. If a video introduces a distinct messaging angle while the carousel focuses on a separate technical proof-point, the test evaluates copy angle rather than media vehicle efficacy.
You must deploy a unified asset specification matrix across all variations:
-
The Anchor Hook: The headline, primary text opening sentence (the first 125 characters before the fold), and display URL must be identical across the video, static image, and multi-card carousel.
-
Value Proposition Parity: Every format must articulate the identical product transformation, pricing benchmark, or architectural pain point. If the video illustrates API latency reductions, the static graphic must display the exact benchmark diagram, and the carousel must sequence the identical architectural migration steps.
-
Deterministic Tracking Taxonomies: Maintain identical landing page destinations and downstream lead-capture mechanisms, modifying strictly the format parameter in your UTM string. Standardize query strings using a strict naming convention:
utm_content=video_p1_v1,utm_content=static_p1_v1, andutm_content=carousel_p1_v1.
-
Deploying this matrix within an enterprise-grade automated testing governance model guarantees that variations in customer acquisition cost (CAC), pipeline velocity, and demo conversion rates stem entirely from the creative delivery format, completely free from algorithmic budget skew or messaging noise.
Ingesting telemetry via server-side GTM and edge pipelines
Client-side tracking for B2B paid social creative testing introduces immediate telemetry corruption. When benchmarking high-friction assets like interactive carousels against top-of-funnel short-form video, reliance on browser-level JavaScript routinely drops 25% to 40% of conversion signals. Safari’s Intelligent Tracking Prevention (ITP) caps client-set storage to 24 hours or seven days under link decoration heuristics, while network-level content blockers silently terminate tracking scripts before the client payload initializes. This creates systemic attribution bias: single-session static ad conversions appear functional, whereas multi-touch video nurturing paths and non-linear carousel card interactions suffer total lineage breakage.
Edge-Routed Telemetry and Attribution Lineage
To isolate creative format performance from browser-level degradation, telemetry must be captured at the network edge and ingested through a dedicated proxy layer. Instead of executing direct vendor pixels on the user device, ad parameters—including creative_id, ad_format (video, static, or carousel), and interaction coordinates—are passed via URL query fragments into an edge worker (such as Cloudflare Workers or Fastly Compute@Edge).
The edge worker intercepts the initial navigation request, extracts the ad-level metadata, and executes two concurrent operations:
- It writes a secure,
HttpOnly,SameSite=Laxfirst-party cookie directly inside the HTTP response headers, minting an unconstrained identifier (__session_lineage) that bypasses client-side storage constraints. - It constructs an asynchronous JSON payload containing normalized engagement telemetry and routes it directly to a provisioned instance of Server-Side Google Tag Manager (sGTM).
For robust execution, teams rely on dedicated server container infrastructure deployment to manage transformation pipelines, parse egress APIs, and distribute deduplicated signals downstream to Meta Conversions API (CAPI) and LinkedIn Conversions API.
Telemetry Payload Normalization
Edge ingestion normalizes raw creative interaction data into an immutable event envelope before sending it downstream to sGTM:
{
  "event_name": "creative_interaction",
  "client_id": "c7a8d569-42b1-4f9e-9908-112233445566",
  "meta": {
    "campaign_id": "b2b_q1_pipeline",
    "creative_id": "cr_video_arch_v2",
    "ad_format": "video",
    "playback_quartile": 75,
    "carousel_card_index": null,
    "viewport_dwell_ms": 14200
  },
  "user_data": {
    "ip_address": "request.headers.client_ip",
    "user_agent": "request.headers.user_agent"
  }
}
Pre-AI Telemetry vs 2026 AI-Driven Ingestion
Historically, split testing different formats for a paid social creative relied on fragile client-side triggers: DOM scrapers checked video progress intervals, while carousel clicks depended on unverified UI click listeners. If a prospect engaged with cards 1 and 3 of a carousel before converting 14 days later on desktop, client-side attribution dropped the initiating format entirely due to cookie resets.
Modern 2026 telemetry pipelines replace client-side heuristics with programmatic edge orchestration:
-
Identity Resolution: Edge workers generate cryptographically signed master identifiers that link disparate multi-touch events across mobile in-app browsers and corporate desktop networks.
-
Payload Sanitization: Ingestion pipelines validate incoming creative schemas against strict server-side contracts, dropping corrupt query parameters and preventing malformed attribution records.
-
Dynamic Signal Scoring: Rather than treating a 3-second video view identically to a full-sequence carousel scroll, edge telemetry computes an interaction depth index (e.g.,
depth_score = (dwell_time_ms / asset_duration_ms) * format_weight) and transmits this continuous metric directly to downstream models.
-
Mapping creative formats to enterprise buying stages
Enterprise procurement cycles involve multi-stakeholder consensus across distinct operational and financial domains. Directing a single ad asset across an entire account committee degrades conversion efficiency; the Chief Technology Officer evaluates latency overhead, the Head of Infrastructure interrogates deployment topologies, and the Chief Financial Officer scrutinizes seat-versus-consumption amortization. Aligning your paid social creative matrix to specific buying committee personas and pipeline stages converts ambient attention into verified technical qualification.
Top-Funnel Distillation: High-Density Technical Video
Short-form technical video should rarely attempt bottom-funnel conversion. At the problem-distillation stage, engineering leadership seeks proof of architectural viability, not brand positioning. In pre-AI workflows, teams deployed 60-second animated corporate explainers that yielded high drop-off rates past second four. Modern 2026 growth architectures replace polished brand creative with unedited 15-to-30-second terminal recordings, CLI execution runs, and high-framerate screencasts.
These assets isolate a single operational bottleneck—such as unoptimized vector database queries or slow Kubernetes rollout orchestrations—and resolve it within the first three seconds of runtime. Video formats serve as programmatic filters: engineers who watch past the 50% milestone self-select into your audience pool, triggering automated retargeting sequences across your edge telemetry layer without human intervention.
Mid-Funnel Evaluation: The Carousel as a Self-Qualification Engine
Multi-frame carousels function as interactive inspection environments for mid-funnel technical validation. Rather than treating carousels as sequential storyboards, technical marketing teams deploy them as modular data sheets. Each slide delivers a self-contained proof point designed for distinct functional evaluators:
-
Card 1: Core Interface — Visual confirmation of native IDE integration or centralized dashboard telemetry.
-
Card 2: API Specification — Raw cURL request and JSON payload schema exposing query structures.
-
Card 3: Feature Parity Table — Binary matrices contrasting proprietary runtime performance against legacy infrastructure.
-
Card 4: Compliance Frameworks — Direct evidence of SOC2 Type II, ISO 27001, HIPAA, and GDPR isolation boundaries.
-
Card 5: Zero-Trust Network Architecture — Egress controls, VPC peering mechanics, and encryption-at-rest implementations.
-
This format drives self-directed engagement. When an Infrastructure Lead swipes to examine an API endpoint card, their explicit interaction signals technical buying intent, allowing reverse-IP and cookie-free telemetry to tag the enterprise domain for prioritized SDR acceleration.
Bottom-Funnel Validation: High-Friction Removal via Static Assets
Single-image static creatives dominate bottom-funnel conversion by eliminating cognitive latency. At the late pipeline phase, enterprise buyers do not require narrative context; they require verifiable data points to justify sign-off to executive peers. Static creatives present complex system architecture diagrams, clear consumption-tier pricing, or enterprise certification badges instantly, demanding zero interaction cost.
Pipeline Stage       Creative Format   Primary ICP Target   Conversion Mechanism
Top-Funnel (Aware)   CLI Screencast    Head of Platform     Telemetry Retargeting
Mid-Funnel (Eval)    Tech Carousel     CTO / Architect      Interactive Specification
Bottom-Funnel (Buy)  Static Diagram    CFO / VP Infra       Instant Validation (Direct Demo)
The table below outlines the enterprise alignment across evaluation stages:
| Ad Format | ICP Role | Buying Stage | Asset Content | Primary Conversion Action |
|---|---|---|---|---|
| Technical Video (15s) | Head of Infrastructure | Top-Funnel (Problem Discovery) | Headless terminal execution, CLI workflow | View 75% / Audience Seed |
| Modular Carousel (5-Card) | Principal Architect / CTO | Mid-Funnel (Technical Evaluation) | API payloads, compliance matrix, throughput benchmarks | Documentation Read / Spec Sheet Download |
| Static Image | VP of Engineering / CFO | Bottom-Funnel (Procurement / Security) | VPC topology diagram, transparent seat pricing, SOC2 seal | Direct Sandbox Spin-up / Sales Demo |
Downstream pipeline analysis: bridging ad format data to BigQuery and CRM
Evaluating top-of-funnel metrics like click-through rate (CTR) or platform-reported cost-per-lead (CPL) obscures true unit economics. High-performing paid social creative must be judged on downstream pipeline metrics: Sales Qualified Lead (SQL) conversion velocity, opportunity win rates, and closed-won Annual Contract Value (ACV). Bridging paid social formats—video, static, and carousel—to ultimate revenue requires an automated telemetry backbone terminating in a unified data warehouse.
Relational Schema and Warehouse Joins
To measure real pipeline impact, ingest ad-level platform spend tables (LinkedIn Marketing Solutions API, Meta Graph API) alongside client-side clickstream events (Segment or GA4 via raw BigQuery exports) and CRM objects (Salesforce or HubSpot).
Platform extraction scripts store the ad creative identifier alongside format taxonomies in an ingested table (stg_ad_metadata). Raw touchpoints map utm_content or explicit creative_id query parameters directly into the initial session logs. By leveraging a centralized BigQuery relational schema structure, touchpoints join cleanly to CRM contact records using hashed identity graphs (lead_email_sha256) and anonymous cookies (client_id).
SELECT
    meta.ad_format,
    COUNT(DISTINCT crm.lead_id) AS total_leads,
    COUNT(DISTINCT CASE WHEN crm.stage = 'SQL' THEN crm.lead_id END) AS total_sqls,
    ROUND(COUNT(DISTINCT CASE WHEN crm.stage = 'SQL' THEN crm.lead_id END) / NULLIF(COUNT(DISTINCT crm.lead_id), 0) * 100, 2) AS mql_to_sql_rate,
    ROUND(AVG(DATE_DIFF(crm.close_date, crm.created_date, DAY)), 1) AS avg_pipeline_velocity_days,
    ROUND(SUM(crm.closed_won_acv) / NULLIF(SUM(spend.ad_spend), 0), 2) AS format_roas
FROM `growth_dw.stg_ad_spend` spend
JOIN `growth_dw.stg_ad_metadata` meta
    ON spend.ad_id = meta.ad_id
LEFT JOIN `growth_dw.attribution_touchpoints` touch
    ON meta.ad_id = touch.ad_id
LEFT JOIN `growth_dw.crm_opportunities` crm
    ON touch.contact_id = crm.primary_contact_id
GROUP BY 1;
Isolating Revenue Velocity vs. Top-of-Funnel Drag
Pipeline velocity calculates the real sales acceleration per creative format:
Velocity = (SQLs * Win_Rate * Average_Deal_Size) / Sales_Cycle_Days
In enterprise SaaS cohorts, video ads frequently drive 40% lower CPL and double the click volume of single-image assets. However, downstream telemetry often reveals a high-friction dynamic: top-of-funnel video creative attracts low-intent operational leads rather than technical decision-makers.
Static single-image ads typically display higher initial acquisition costs but yield superior MQL-to-SQL transition ratios (frequently 22% versus 8% for short-form video). Technical decision-makers respond to high-density diagrams and feature specifications embedded in carousels and static graphics, while passive consumers click through high-tempo videos without intent to evaluate architecture.
Identifying the Negative Quality Bias
Without warehouse-level CRM attribution, growth engines risk falling into negative quality bias. A rapid influx of sub-tier leads from top-of-funnel video creatives artificially satisfies platform-level lead goals while creating substantial technical churn in downstream sales engineering. Solutions architects waste billable cycles on discovery calls for accounts outside the Ideal Customer Profile (ICP).
Tracking sales_cycle_days and closed_won_rate by creative format uncovers whether lower upfront acquisition costs offset sales engineering drag. By isolating pipeline velocity at the format level inside BigQuery, teams adjust creative rotation based on enterprise closed revenue rather than transient engagement metrics.
Zero-touch creative performance orchestration with n8n and AI agents
Manual creative rotation in B2B performance marketing introduces latency, attribution blind spots, and capital misallocation. Operating high-velocity tests across video, static, and carousel assets requires an event-driven automation framework that binds ad platform APIs directly to bottom-funnel CRM pipeline data.
Pipeline Architecture: Syncing Ad APIs with CRM Telemetry
By deploying an automated orchestration workflow in n8n, teams replace subjective reviews with deterministic deprecation rules. The execution flow begins on a cron trigger, querying platform reporting endpoints across LinkedIn Campaign Manager, Meta Graph API, and Google Ads. Because platform-reported metrics suffer from conversion modeling discrepancies, the workflow matches platform click IDs against your data warehouse (such as PostgreSQL or Snowflake) using reverse-ETL pipelines and webhook receivers.
{
  "node": "Postgres_CRM_Lookup",
  "type": "n8n-nodes-base.postgres",
  "parameters": {
    "operation": "executeQuery",
    "query": "SELECT creative_id, COUNT(DISTINCT lead_id) AS sql_count, SUM(pipeline_value) AS total_opp_val FROM attribution_touchpoints WHERE platform = 'meta' AND campaign_id = $1 GROUP BY creative_id;"
  }
}
When integrating delayed conversions from sales cycles that exceed 30 days, implement strict asynchronous polling logic to reconcile attribution webhooks against the platform API limits without hitting rate constraints. If a creative asset spends 2.5 * Target_CAC without yielding an authenticated Sales Qualified Lead (SQL) or passing a minimum qualification threshold of Opportunity_Score >= 0.70, the n8n orchestrator fires a POST request to the platform API mutation endpoint, setting the creative status to PAUSED.
AI Agent Diagnostics: Granular Asset Iteration
Beyond binary kill-or-scale decisions, modern paid social creative optimization requires structural asset modification based on in-frame engagement drop-offs and interaction funnels. Instead of scrapping underperforming formats, an n8n AI Agent Node parses micro-telemetry data to detect specific friction events:
-
Carousel Drop-off Anomalies: The workflow ingests sequential engagement rates per card. If Card 1 retains an
85%swipe-through rate to Card 2, but drop-off between Card 2 and Card 3 hits68%, the AI agent isolates Card 2 as a structural conversion bottleneck.- Video Drop-off Latency: The agent evaluates sub-second video retention curves. A steep retention cliff at second 3 indicates hook failure, whereas a mid-point drop at second 12 indicates weak conceptual transition into the product demonstration.
{
  "event": "carousel_iteration_trigger",
  "ad_id": "meta_cr_98213",
  "friction_node": "card_2",
  "action": "reorder_sequence",
  "new_sequence": ["card_1", "card_3", "card_2", "card_4"],
  "confidence_score": 0.94
}
Pre-2026 workflows required visual creative audits and manual redesign tickets inside project management tools, burning 5 to 7 business days per test cycle. In this autonomous framework, the AI agent passes payload instructions directly to an asset assembly API (such as Bannerbear or Remotion via dynamic JSON templates).
If a carousel reveals that social proof on Card 4 generates a higher terminal click-through rate than the product interface screenshot on Card 2, the agent programmatically swaps the array sequence, provisions a newly sequenced asset, pushes the draft ad back into the live campaign, and re-allocates 15% of the campaign budget to the reconfigured variant. Human operators only review aggregated telemetry reports inside Slack, letting the deterministic pipeline execute low-level format iterations in real time.
First-party identity resolution across prolonged enterprise evaluation cycles
Enterprise B2B sales cycles typically span between 90 and 270 days, involving multi-stakeholder buying committees and fractured multi-device pathways. Standard client-side tracking and default ad network attribution windows—capped strictly at a 7-day click or 1-day view—fail completely in this operating environment. When enterprise demand generation teams test top-of-funnel paid social creative formats like high-production motion video or interactive carousels, the true downstream pipeline contribution decays invisibly before a CRM opportunity ever registers.
The Mechanics of Paid Social Attribution Decay
Default browser sandboxing (Apple Safari ITP, Firefox ETP, and Chromium-partitioned storage) discards client-side ephemeral identifiers within 1 to 7 days of inactivity. If a Director of Infrastructure watches an architectural video ad on LinkedIn via mobile, visits your landing page, and circulates the solution internally across desktop workstations over the subsequent four months, the ad network logs a zero-conversion drop-off.
The evaluation committee eventually converts via an organic brand search, direct URL entry, or an outbound sales touchpoint. Consequently, performance reports incorrectly penalize paid social creative variants that generate high initial pipeline velocity, systematically reallocating capital to low-leverage bottom-of-funnel retargeting tactics.
Engineering a 180-Day Server-Side Identity Graph
Bridging this structural attribution deficit requires bypassing browser-level storage constraints. By migrating telemetry from client-side JavaScript tags to edge-routed collector endpoints, marketing engineers can establish durable first-party identification persistence through server-side secure cookies configured with HttpOnly, SameSite=Lax, and raw Path=/ parameters.
Client Interaction (Ad Click / Page View)
  │
  ▼
Edge Reverse Proxy (Cloudflare Worker / AWS CloudFront)
  │
  ├── Sets `__Host-fpid` Cookie (Max-Age: 15,552,000s / 180 Days)
  ├── Extracts Client Hints (IP, User-Agent, Accept-Language)
  │
  ▼
Server-Side GTM / Event Ingestion Engine
  │
  ├── Real-time IP Reverse Lookup (ASN to Company Domain)
  ├── Canonical SHA-256 Hashing (Work Email, Corporate Subnet)
  │
  ▼
Deterministic / Probabilistic Graph Engine (ClickHouse / BigQuery)
  │
  ▼
CRM Ingestion (Opportunity / ARR Matchback via Closed-Won Hooks)
The server-side identity infrastructure operates on a dual-layer resolution pipeline:
-
Deterministic Matching: Captures hashed business emails from gated whitepaper downloads, product documentation access, or interactive assessment calculations embedded in carousel payloads. Once captured, the raw user ID joins directly to the persistent
__Host-fpidtoken. -
Probabilistic Domain Enrichment: Enriches anonymous page hits at the edge using corporate IP reverse-lookup databases (MaxMind GeoIP2 Enterprise, 6sense, or Clearbit Reveal API). The telemetry matches the ASN and domain against target accounts in your CRM, maintaining pipeline tracking across team members who never clicked the original paid social creative directly.
Pre-AI Stitching vs. 2026 AI-Orchestrated Identity Graphs
Historical attribution pipelines relied on brittle SQL cron jobs executing exact-match joins on landing page UTM parameters and lead capture forms. In 2026 architectures, identity resolution executes dynamically using probabilistic vector modeling and autonomous webhook orchestration:
| Dimension | Legacy Heuristic Tracking (Pre-AI) | 2026 AI-Orchestrated Graph |
|---|---|---|
| Persistence Window | 7 to 30 days (capped by browser ITP) | 180 to 365 days via edge-issued __Host- headers |
| Identity Resolution | Strict form-fill email matching only | Multi-entity stitching: Account ASN, Subnet, and Canvas hashes |
| Format Evaluation | Last-touch CPA; video/carousel undervalued | Algorithmic Shapley-value revenue matchback to raw creative assets |
| Data Pipeline | Manual CSV uploads to offline conversion APIs | Autonomous n8n webhooks updating Meta CAPI and LinkedIn CAPI in real time |
By maintaining an unbroken identity path from the initial engagement with a paid social creative format to the signed Master Services Agreement (MSA), engineering teams recover up to 42% of previously lost attribution paths. This architectural baseline allows growth teams to invest accurately in long-form technical video or feature-dense carousels based on qualified pipeline generation rather than shallow, 7-day conversion metrics.
Financial modeling: format-specific CAC, LTV, and burn rate optimization
Traditional attribution frameworks distort B2B performance by siloing media spend from asset generation overhead. When engineering a scalable Paid Social Creative engine, calculating efficiency strictly through platform-reported Cost Per Click (CPC) or Cost Per Acquisition (CPA) introduces capital misallocation. Enterprise go-to-market pipelines require format-specific unit economics that capture production latency, cloud orchestration overhead, and pipeline velocity.
The CPVEO and Fully Loaded Format-CAC Formulations
To eliminate top-of-funnel vanity reporting, growth engineering teams must isolate the Cost Per Verified Enterprise Opportunity (CPVEO) and evaluate format-level performance using fully loaded capital inputs:
CPVEO_f = (MediaSpend_f + ProductionOverhead_f + ComputeAllocation_f) / VerifiedOpps_f
Where:
-
MediaSpend_f: Gross ad spend allocated to formatfacross network distributions.-
ProductionOverhead_f: Linear engineering and design overhead amortized over asset lifespan, spanning $3,500 to $8,000 for high-fidelity 3D/motion product demos down to $40 for dynamic programmatic images. -
ComputeAllocation_f: Infrastructure costs for headless browser rendering, video transcription, dynamic creative optimization (DCO) APIs, and model fine-tuning; treat these via rigorous cloud FinOps cost allocation principles. -
VerifiedOpps_f: Qualified Stage-2 enterprise pipeline accounts (Sales Accepted Leads with confirmed ICP and budget clearance).
-
Applying this model surfaces the true Net Format Return on Capital Employed (Net ROCE):
Net_ROCE_f = ((ACV * GrossMargin * NetWins_f) - TotalInvestment_f) / TotalInvestment_f
Production Cost Decay vs. Acquisition Yield
Asset decay curves dictate whether capital expenditure amortizes or destroys acquisition margins. High-fidelity motion graphics introduce substantial friction: rendering multi-scene product videos demands complex design sprints, continuous UI updates, and higher marginal production costs.
While industry consensus emphasizes short-form video asset engagement for initial impressions, technical B2B software buyers display different conversion behaviors. In enterprise SaaS selling into infrastructure, security, and developer verticals, multi-slide document and image carousels systematically outperform video on net enterprise margins.
| Creative Format | Production Cost per Unit | Median Platform CPL | Opportunity Conversion Rate | Fully Loaded Enterprise CPVEO |
|---|---|---|---|---|
| Motion Product Video (30-60s) | $4,200 - $9,500 | $180 - $340 | 4.2% | $4,800 - $7,200 |
| Programmatic Static Asset | $25 - $75 | $90 - $160 | 2.1% | $4,400 - $6,100 |
| Technical Architectural Carousel | $180 - $450 | $110 - $210 | 6.8% | $2,100 - $3,400 |
Burn Rate Optimization Across the Lifecycle
Enterprise carousel architectures win on acquisition margin because they facilitate high-density technical consumption at user-controlled velocity. Buyers self-select into slide sequences detailing architecture diagrams, data pipelines, and security topologies without buffering or acoustic requirements.
By contrasting carousels generated via automated headless browser pipelines (Playwright/Puppeteer rendering HTML templates) against human-engineered video productions, the amortized production cost per asset drops by up to 92%. In tight burn environments, reallocating 60% of video production budgets into programmatic carousel experimentation delivers higher frequency, lower fatigue rates, and a 35% to 50% decrease in final CPVEO across enterprise tiers.
The 2026 execution blueprint: algorithmic synthesis and headless creative systems
The legacy creative production lifecycle—characterized by manual Figma iterations, static asset exporting, and human media buyers staging campaigns inside ad managers—represents an operational bottleneck that caps enterprise scaling. In the modern B2B growth stack, Paid Social Creative functions not as static design files, but as dynamic software compiled just-in-time at the network edge.
Decoupling Asset Production: Headless Creative Engines
Traditional creative testing cycles suffered from an average 14-day latency between hypothesis generation and campaign launch. Modern headless architecture collapses this feedback loop to under four minutes. By decoupling design layouts into headless components—using tools like Satori for SVG-to-PNG generation and Remotion for programmatic React-rendered MP4s—creative teams define the structural templates while autonomous ingestion pipelines handle generation.
Instead of manually rendering twenty variations of a carousel ad, an orchestration workflow built in n8n queries a vector database, retrieves validated value propositions, and executes parallel API calls to render complete asset matrices:
-
Modular Static Assets: Dynamically rendered image layers combining live dashboard telemetry, company logos, and localized trust badges mapped to target account lists.
-
Programmatic Carousel Sequences: Dynamic card sequencing generated on the fly, where slide order adapts automatically to the technical maturity of the target firm.
-
Dynamic Code-Rendered Video: Programmatic MP4 generation where kinetic typography, product UI screen recordings, and benchmark numbers are compiled via headless Chromium instances.
Dynamic Metadata-Driven Runtime Assembly
Headless creative engines intersect directly with account-based intelligence. When an ad server receives an impression request or a pre-bid enrichment signal via reverse-IP lookup, the system evaluates the target organization's firmographic profile, technographic footprint, and current intent velocity.
Runtime logic shifts the delivery vector based on verifiable data layers. If an account runs a legacy enterprise database, the system outputs a 5-card carousel detailing zero-downtime migration protocols and enterprise compliance certs (SOC2 Type II, ISO 27001). Conversely, when serving impressions to hyper-growth engineering teams, the orchestration layer deploys an 8-second headless video demonstrating command-line interface execution speeds.
The Closed-Loop Self-Healing Pipeline Engine
The terminal phase of this architecture transforms paid social distribution into a self-healing capital allocation system. Traditional campaigns optimize for click-through rate (CTR) or platform-native conversion events, metrics that frequently decorrelate from downstream pipeline value.
By connecting ad platform conversion APIs directly to CRM data warehouses, each creative format acts as a programmable endpoint:
-
Edge workers track individual format performance against closed-won pipeline velocity rather than transient engagement metrics.
-
The engine continuously calculates marginal returns across static, carousel, and video variations, enforcing algorithmic budget switches when customer acquisition cost thresholds breach predetermined bounds.
-
Creative concepts yielding suboptimal pipeline are programmatically retired, prompting the generative engine to synthesize net-new asset iterations without engineering intervention.
Organizations transitioning from manual asset testing to headless, programmatic synthesis routinely compress Cost Per Qualified Opportunity (CPQO) by 35% to 50% while scaling net creative throughput by an order of magnitude.
Format testing in enterprise paid social is not an aesthetic trial; it is a capital allocation protocol governed by strict telemetry. If your growth pipeline relies on native platform attribution to determine whether video, static, or carousel formats deliver pipeline, you are subsidizing ad network margins with unvalidated enterprise CAC. Real efficiency requires a deterministic server-side infrastructure that connects each creative format directly to Closed-Won revenue. To audit and engineer your attribution architecture, explore my technical audit or review my battle-tested deployment patterns in the engineering build logs.
Memo Strategici Correlati
Tutti i Memo →Automated usage warnings that prompt plan upgrades: The zero-touch expansion engine
Human-driven account expansion is an operational liability. Relying on Customer Success managers to review usage dashboards and manually pitch tier upgrades ...
Dead-letter queue management in RabbitMQ and BullMQ: Engineering zero-loss event pipelines
In high-throughput distributed systems, unhandled message failures are silent financial liabilities. Most engineering teams treat Dead-Letter Queues (DLQs) a...
Vuoi implementare questa architettura nella tua pipeline?
Evita i lunghi cicli di vendita e le infinite call di scoperta. Invia il tuo collo di bottiglia di acquisizione o conversione per una diagnosi tecnica approfondita in asincrono.